


Daily Market News - 19th Jan 2022

Time To Buy The Dip In Tech?
What an interesting start to the year.
For me, It’s been fascinating from a Technical perspective to watch, but I’m guessing for most of us, it’s been a case of hanging on and gutting it out.
Violent rotations, energy making waves for the 1st time in a minute, and tech taking the proverbial back seat. Who said this was supposed to be fun?
If you missed my last letter on the 3rd Jan calling 2022 the year of the Valuation Reset - FIND HERE, the question on everyone’s lips at the moment is along the lines of, can we buy the dip in Tech any time soon, so I have a few charts I’d like to share.
10 Year Treasury Note Yield

The 10 Year Treasury Note Yield is breaking out and putting Tech under pressure and while this is the chart getting all the “air time” in Financial media just now, if we take a look at the individual charts for the major averages, I think there’s a picture starting to be painted.
Nasdaq Composite
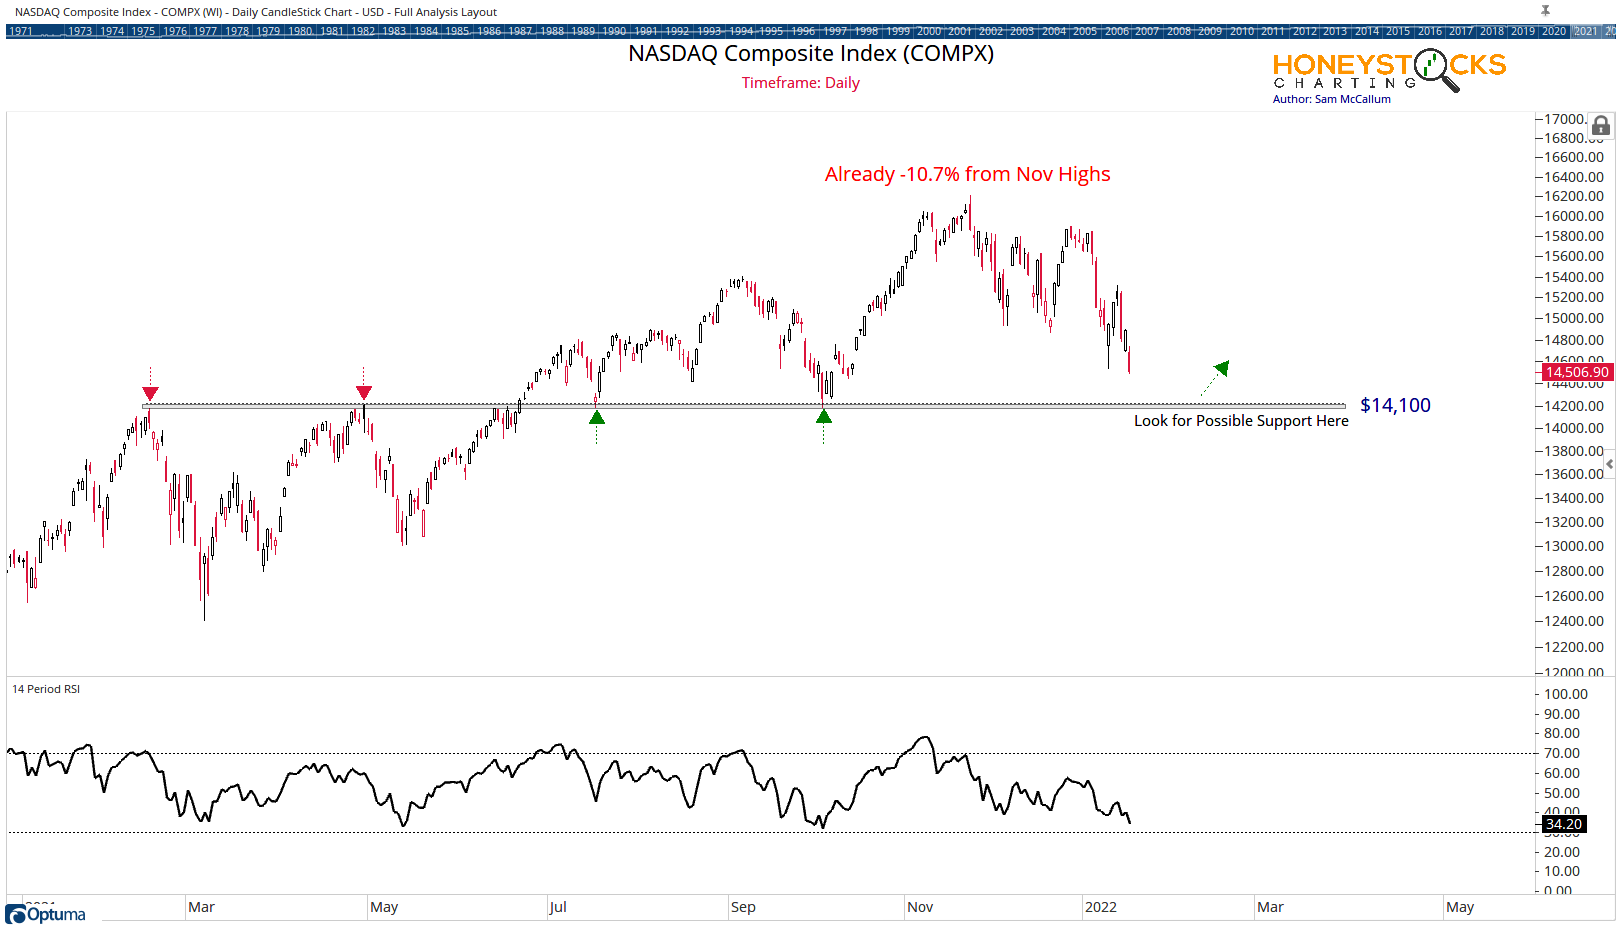
The Nasdaq Composite does this a lot… it declines.
If you’re going to allocate 100% of your portfolio to Tech, it requires a strong stomach. You probably know that.
My message to clients / members over the last couple of months has been to focus on quality names with strong charts, strong earnings growth and fair valuations.
Many of those names just haven’t been in Tech. I don’t make up the rules, so I just adapt whenever the market makes these pivots and it’s why I’ve been focused on Energy, Financials, Materials and Industrials.
Tech v S&P500
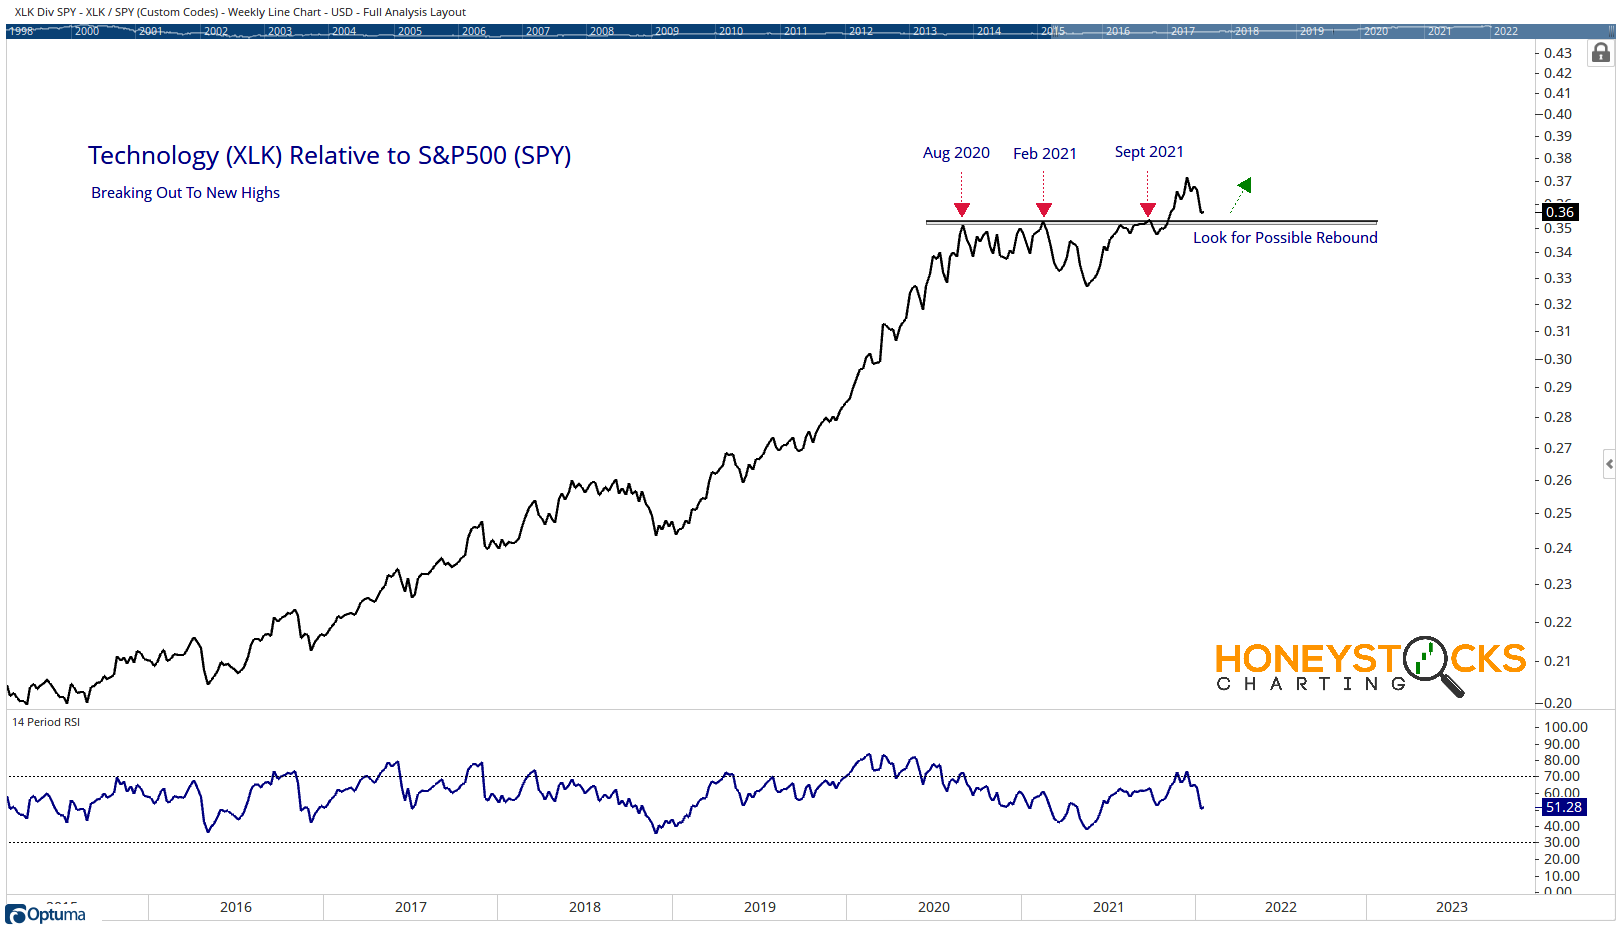
Relative charts are useful because they help with identifying out performance and potential areas where buyers can step in and the XLK/SPY chart is pulling back to a level I want to keep a close eye on.
I’m hoping buyers step in and we stay above 0.35 in this ratio.
There are a couple of charts for individual names that I’ve been communicating to clients / members over the last few weeks that I’d like to share them below.
Vale SA (VALE)
Good Chart, Strong Earnings Growth, Low P/E and crucially, very easy to define the risk (I like a trailing stop loss with defined parameters) and to know when my bullish thesis is falling apart.

Freeport McMorran (FCX)
This is a chart that was sent to our clients and members at the end of October and this week it met the initial 30% upside objective and it’s now a case of awaiting a further break out or revisit on a deep pull back.

In a nutshell, the market is 1 big giant mess at the moment, the conviction I have doesn’t come from the broader market, it’s very much a case of treating each chart on its individual merits and being super selective and if those Tech charts above break down below support, it likely gets VERY messy at an index level.
I’m not 1 of those guys who likes to blindly buy dips or dollar cost average down on growth tech names, I prefer managing risk.
Stay safe out there, it’s a challenging environment for everyone.
Our Big Time Stamped Market Calls