


Daily Market News - 20th Oct

Is The Market Getting Ready To Soar?
The stock market analysis world is very much a case of, what have you done for me lately.
I accept up front I sometimes get things wrong.
Some get it wrong more than others, so it’s worth paying attention to those who do it professionally (but most importantly) and those who are mostly correct.
I think my work probably falls into the latter category, and as most of you who’ve followed me over the years will know, I don’t use the magical hindsight indicator.
You may have seen the chart below this weekend, it was shared by some of the most respected analysts in the game and no doubt some of you picked the Daily Letter on the 7th OCT - FOUND HERE where I called the bottom in Tech also.
Consumer Discretionary (Risk On) vs Staples (Risk Off) Ratio

Turn off the news. Focus on hard data. It’s breaking out.
If consumer discretionary is out performing staples, that’s an environment I’d want to be (and I am) long stocks.
There’s no real debate to be had. I get some of you like to rationalise vaccine data and news reports…. I prefer to focus on what matters. Price.
That said, it would be remiss of me to neglect a few important charts that are now testing key levels which could have an impact on stocks in the short term.
Equal Weight S&P 500 ETF (RSP)
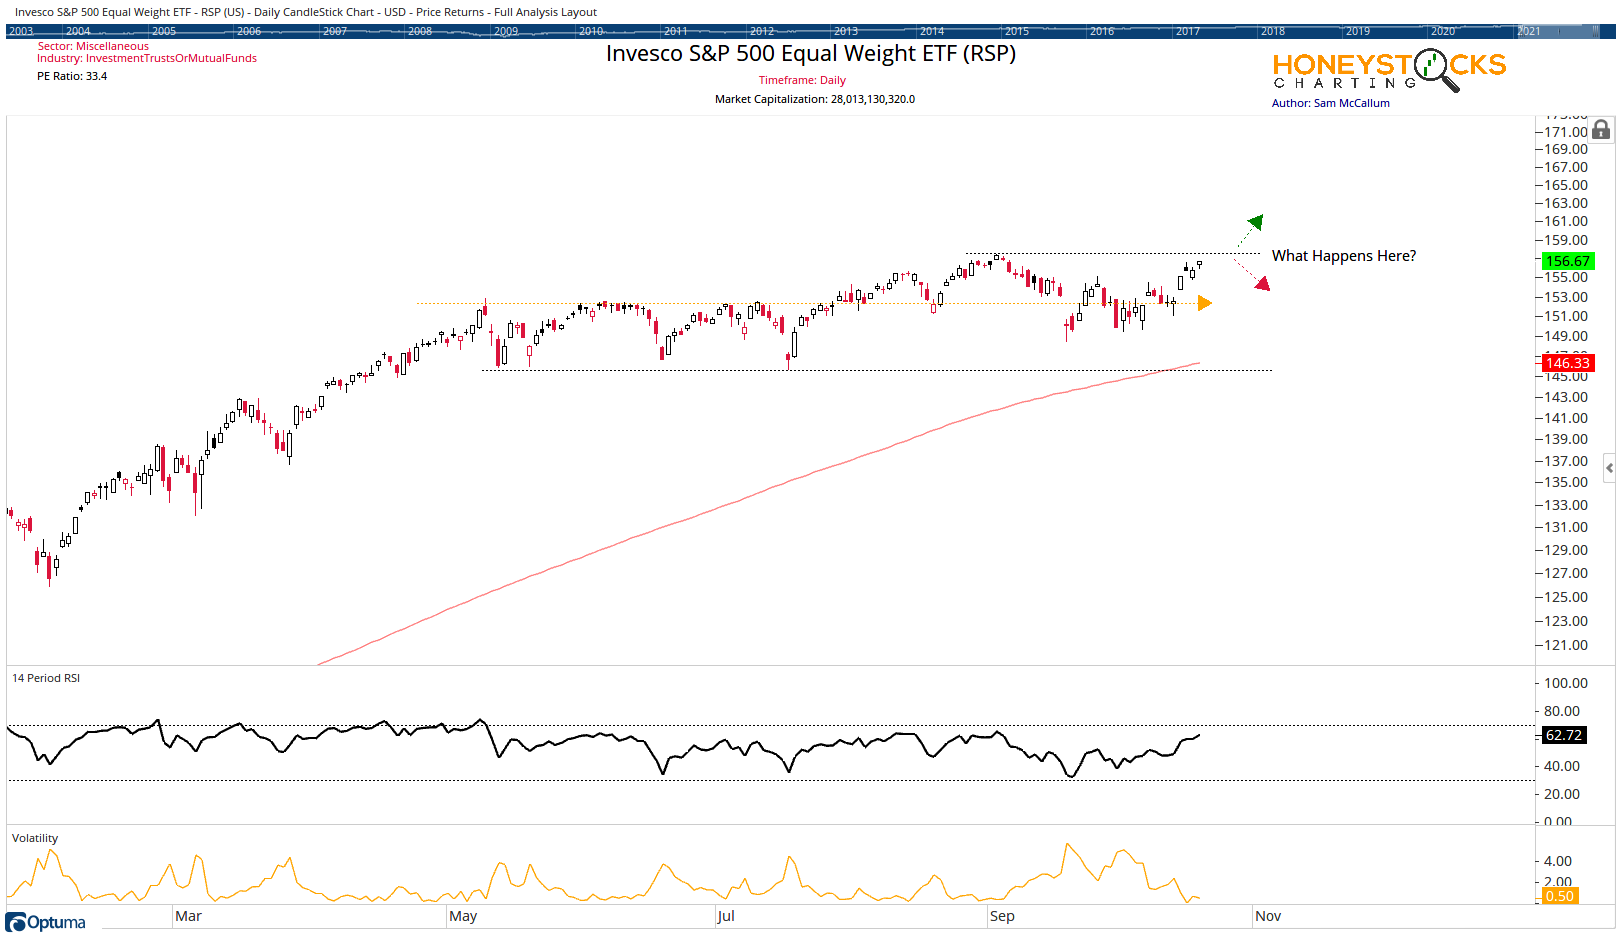
For my work, this is a very important chart.. 1 of those charts many don’t look to because of the Cap Weighted S&P500 gets all the headlines, but this for me is an important chart. If we push up against former resistance and we decline across the board.
That might be an environment where the choppy nature of the market over the last few months could continue to frustrate those who cant find the best up trends in the market.
S&P Midcaps 400 ETF (MDY)

It does have the look of chart that’s primed to rip higher… the short pull back tells me this…. if the midcaps break out, it’s simple… find the best names that’ll rip 5-10% a day.
Russell 2000 Small Caps (IWM)

Same goes for the small caps… find the names that’ll move +10% a day in the event we get a break out.
In Summary
The Market is now technically pushing up against key levels and although US equities look ready to break out and give many a decent end of the year, I’ll keeping a keen eye on the key levels and communicate the best charts in the best sectors to out members over the coming weeks in case we don’t.
My work has recently called the bottom in China on 11th Oct - FOUND HERE
Called a monster break out in Energy on 29th Sept - FOUND HERE
Called the rip in Bitcoin and Cryptocurrency on 1st Oct - FOUND HERE
Called the bottom in Tech on 5th Oct - FOUND HERE
Provided Charts totalling100s of % moves with free Social Media Analysis - FOUND HERE
If you enjoyed the read, feel free to subscribe to our free content, or check out our premium by clicking the button below.
Our Big Time Stamped Market Calls