


Daily Market News - 4th Feb 2022

The Market Rollercoaster
The market isn’t a whole lotta fun just now despite the market putting in a good positive week on the back of extreme volatility.
You’re probably not having much fun unless you’re accustomed to the volatility. I’m practically numb to it at this point (it took me many years to build up the tolerance)
Some of the smartest folks I know managing 10s of millions of dollars are definitely not having fun.
In today’s letter, I want to draw your attention to the strength in the market and some of the charts that’ve helped my clients / members navigate the markets over these last couple of weeks.
There are plenty of stocks going up and many stocks rebounding off of recent lows. I want to share a few names with you.
Premium Chart Performance

The names above are the charts provided to our clients and members last weekend and how those stocks have performed over the last week amidst a choppy market.
I have a few charts with good fundamentals that I want to share below, because I think there is opportunity to be had in many areas of the market just now.
Vale SA (VALE)
Instead of blindly buying dips or downright downtrends, I like to let charts set up and tell me when they’re appealing again rather than blindly buy on the way down hoping to catch the absolute bottom… I prefer to pay a higher price for a stock so that I can define the risk and follow some kind of structure.
I’ve been covering VALE for my clients/members since it broke out at $15, and it’s doing ok just now and could potentially break out again. I have a trailing stop in place and will sell the position when price tells me to.

T-Mobile (TMUS)
Unless you’re a professional chartist, there’s little to no hope of identifying these type of charts that are textbook Fibonacci. As long as the stock is above $100 and that 200 Week Simple Moving Average, I don’t see any issues with it.
Entry is a little tricky as it has move 20% from its low, but a pull back could potentially offer entry.

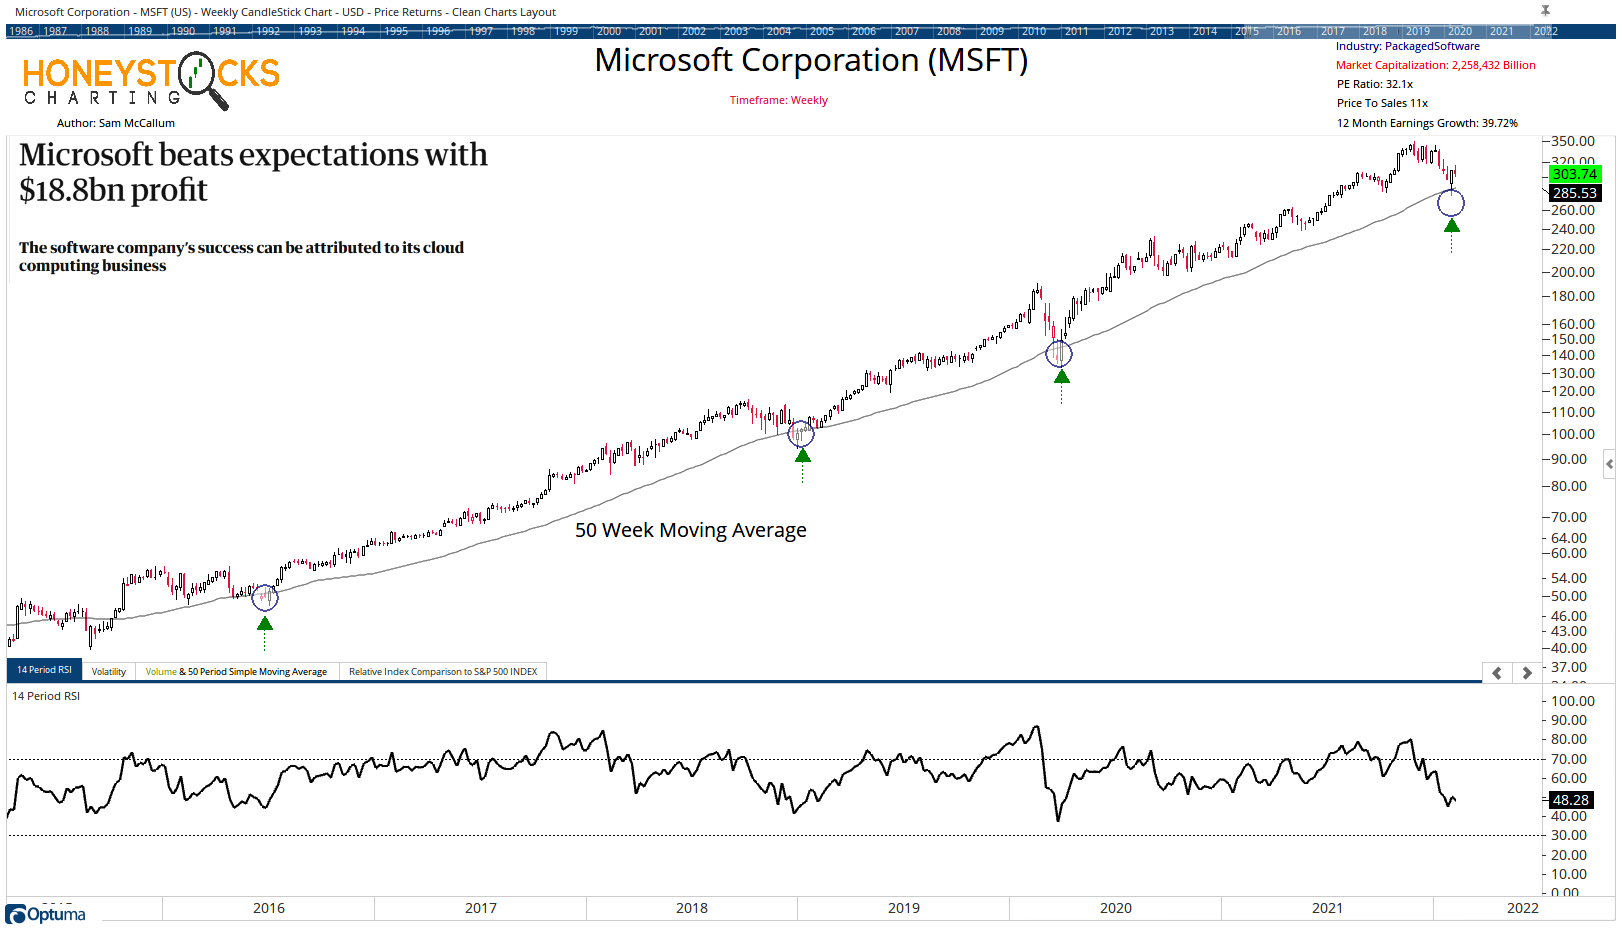
Microsoft (MSFT)
Tech has had a pretty brutal time of it these last couple of months, but when we see these deep pull backs, I like to zoom out and take a 20,000ft view and when we apply basic tools like moving averages, it helps us to gauge where we can potentially see price dip to, and of course, that can offer an opportunity to either add to a position or take a new entry, with a very easy out.
Conclusion
It’s a mess out there. Corrections are never fun.
There are pockets of strength out there, you just need to be open minded to moving into areas that just haven’t been appealing for many years.
As always, I reserve the right to change my views on 30 seconds notice the second new information presents itself.
I’ll have my weekly premium analysis going out to members in the coming hours, feel free to check out the options below.
I also laid out 20+ charts last week in case you missed it.
Our Big Time Stamped Market Calls