


Daily Market News - 11th October 2022

Time To Buy The Fear?
It’s been a nightmare year to forget unless you’ve been heavily invested in the US Dollar or Energy. Lets not sugar coat things. 2022’s been tough going.
If all you’ve done is buy growth tech names or heaven forbid, blindly follow the cults of Cathie and Cramer, it’s probably been even tougher.
There’s nothing we can do about the past, but we can look forward.
This week I’m going to walk through some data and give a little perspective on the price action we’re currently seeing.
Lets start with investor psychology.
I always take charts like this with a pinch of salt.
It’s like the charts tracking price to 1929, that do the rounds every time the market drop 10%. They’re largely pointless.
Investor psychology on the other hand, doesn’t really change. Behaviour doesn’t really change. Which is why I find the movement of price in 2022 fascinating.
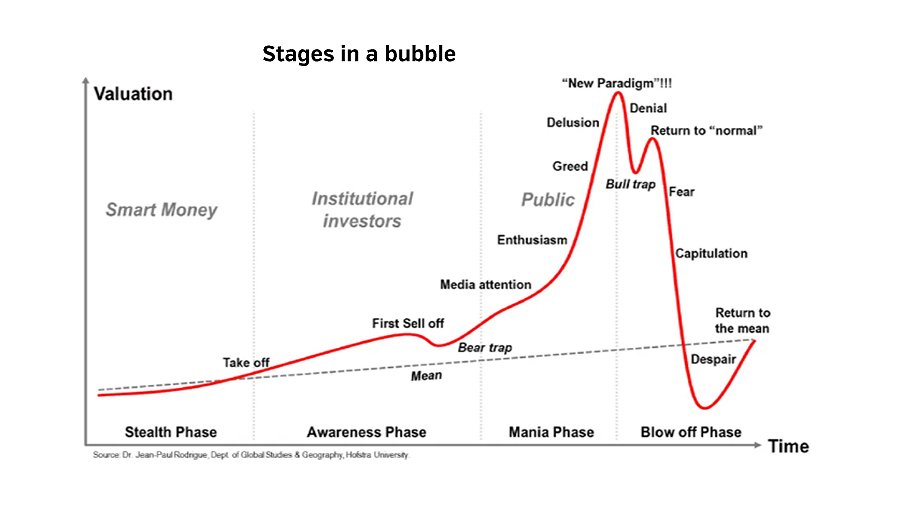
Lets overlay the stages of a bubble to the present day S&P500 (SPX)

Where are we in the Fear / Capitulation / Despair cycle?
It’s up for debate. We won’t know until after the fact, and it’s also worth saying this might be as bad as it gets and you should probably beware anyone who convinces you they know for certain what comes next.
Earnings season is upon us. We know it’s going to be bad. Has the market already priced in the negativity? Is the Fed going to suddenly pivot on their path to higher Interest rates?

There’s a lot of negative sentiment out there. It’s not just with Fear and Greed. I actually see it better in my emails.
Every time I post my weekly letter to social media, or post any of my analysis to YouTube, I’m inundated with chart requests for stock XYZ because it’s under water 50-80%.
Many are close to giving up because that’s just what crashes do.
Not everyone’s been managing risk this year because many didn’t think the market could crash again after the recent 35% Covid Crash in 2020.
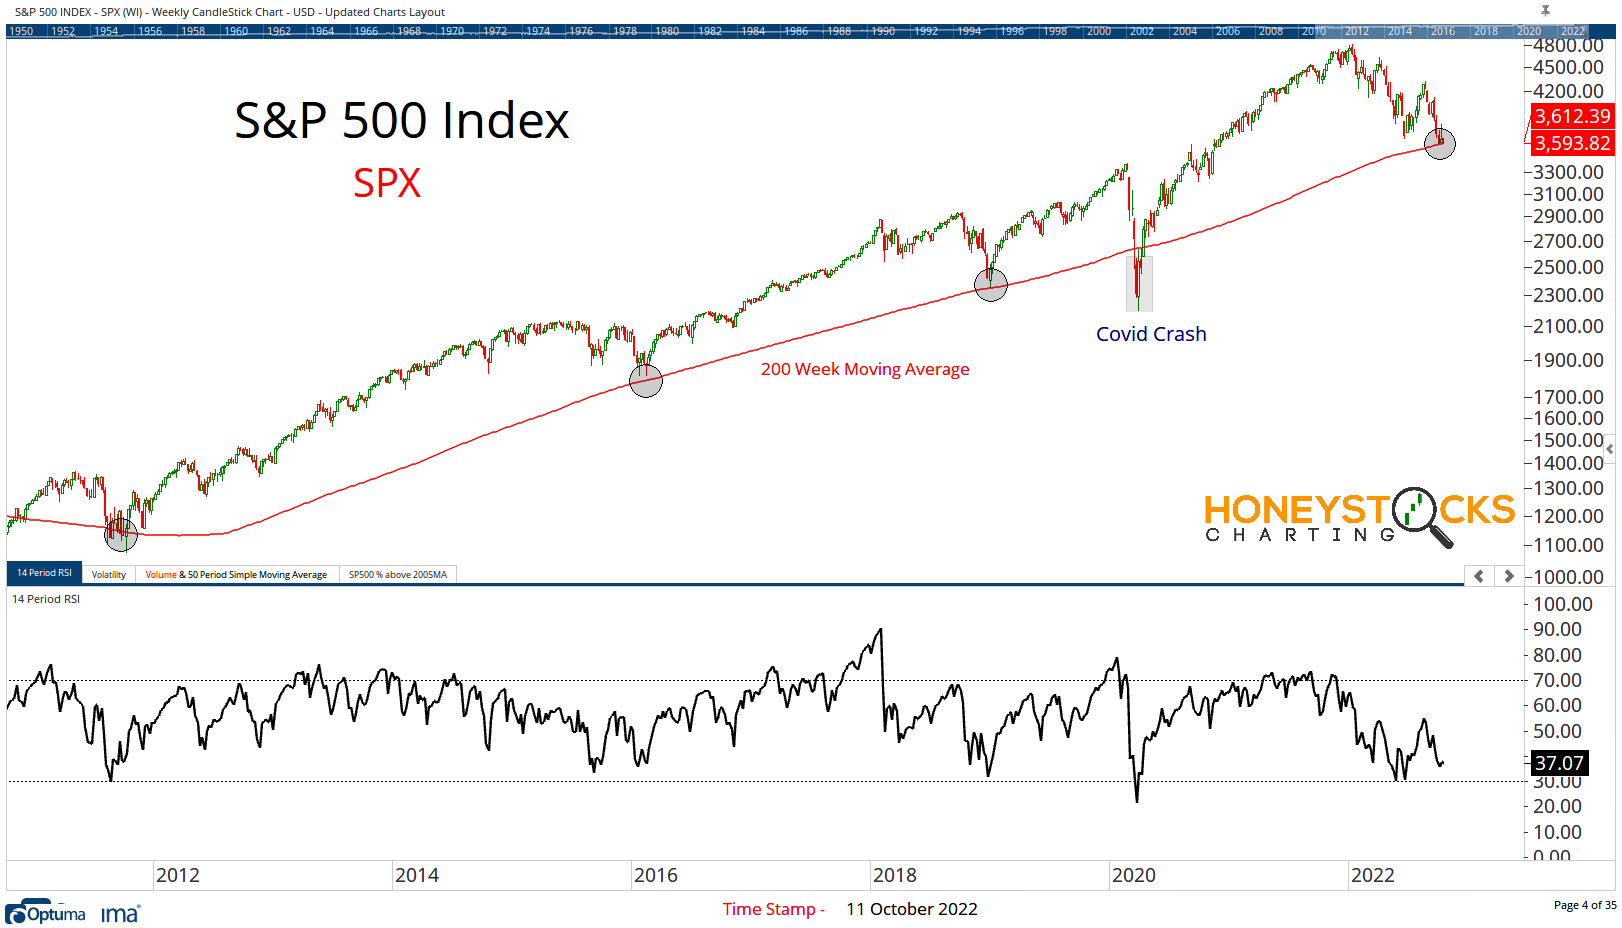
The S&P500 is front and centre.
Many make the mistake of assuming support / resistance levels are “hard levels” and they’ll happily tell you to short if the S&P500 drops below 3,593.82 when the reality is this is just an “area” of support/resistance.
Price will happily oscillate above and below the 200 Week Moving Average.
If we’re going to capitulate, we’re going to see a high volume momentum move below and until we see that, you can probably expect chop in both directions. Especially with the VIX chilling out in the 30s.
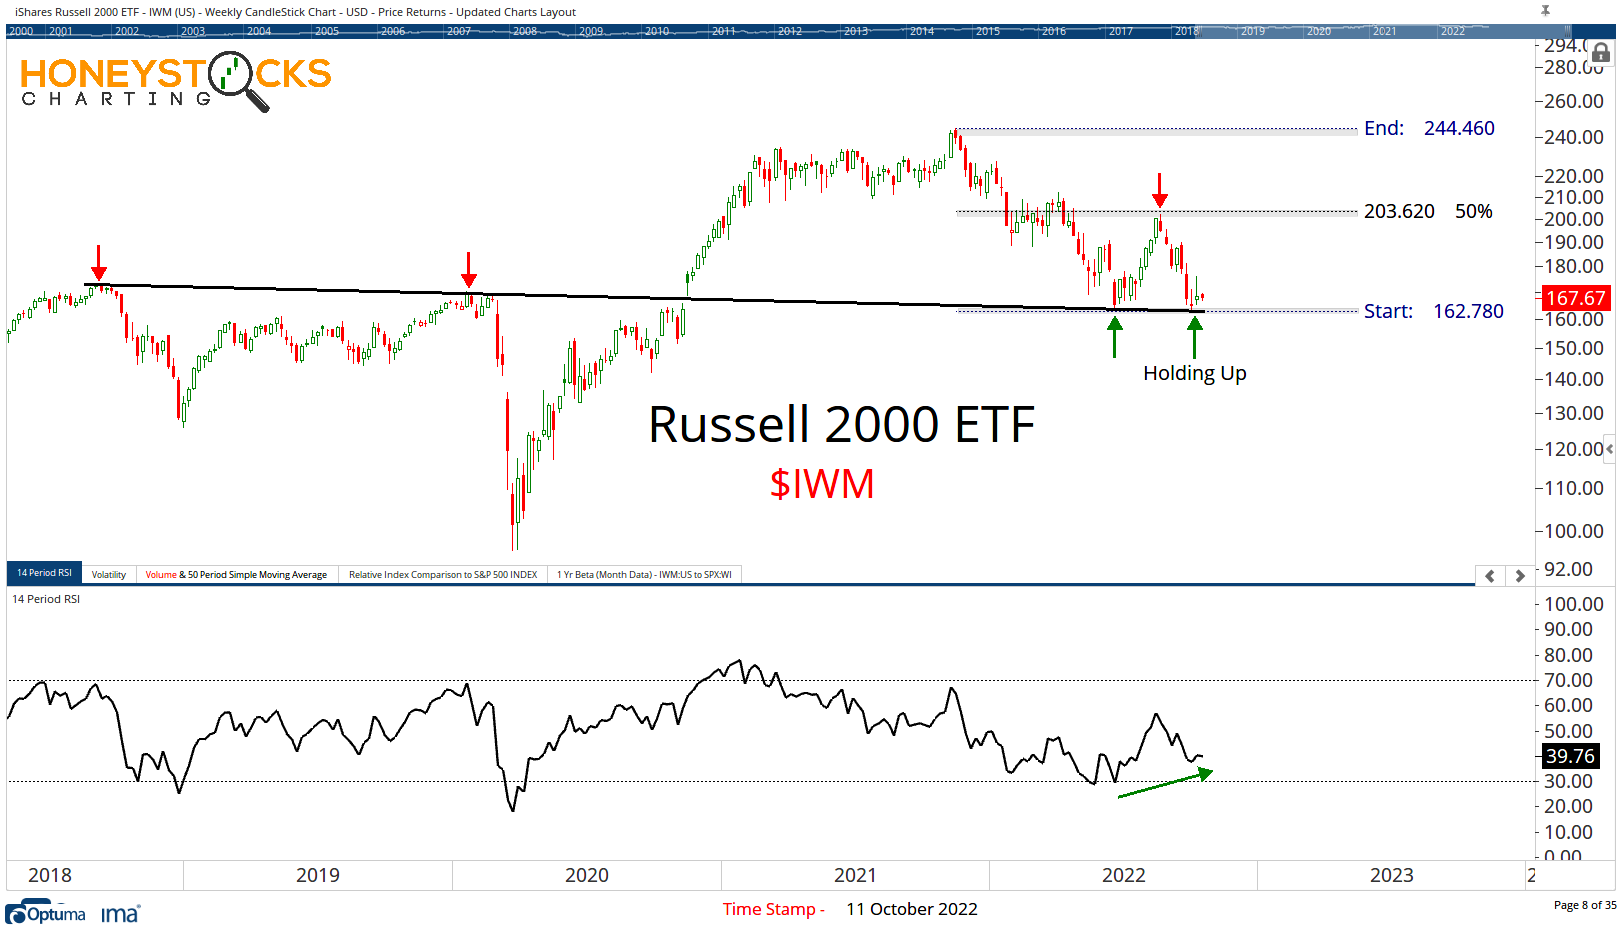
The S&P500 and the Russell 2000 are hanging in there.
If these 2 charts hold up, there’s risk : reward to identify to the upside, but we obviously have many charts moving lower.
Our premium work at the weekend had 5 long and 5 short ideas for the week (our best long was +6% yesterday and our best short was -8%).
There’s opportunity in both directions if you know where to look but getting aggressively long OR short is most definitely a recipe for stress.
Our Big Time Stamped Market Calls