


Daily Market News - 6th October 2022

Take It All In Stride
If you picked up last weeks letter, congratulations, it’s probably been a good week.
If you’re new around here, I made a big call on a short term top in the US Dollar (DXY) and VIX, and a rip in the S&P500, which is pretty much what we got - LAST WEEKS LETTER HERE
The big question coming into the week was how would the Dow and NYSE Composite fare after breaking down last week.
Would they drag us lower or would the S&P500 and small caps hold firm?
Monday / Tuesday given us the biggest 2 day rip higher in 2 years, so there’s that.
While I’m writing this weeks letter, I’ve got some music blasting out and I think there’s a few words we can all learn from the great Myles Kennedy.
“You gotta take it all in stride”
Lets get into some charts.

Coming into the week, we had a confirmed break down in the NYSE Composite, and like all break downs and break outs, you have to pay attention for failed moves.
It’s the down side to buying breaks.
The current environment probably favours the “retest” entry if you’re using Technical’s.
NYA looks to be putting in a constructive failed move, but this is a Weekly chart, therefore a confirmed Friday close is needed to confirm a failed move.

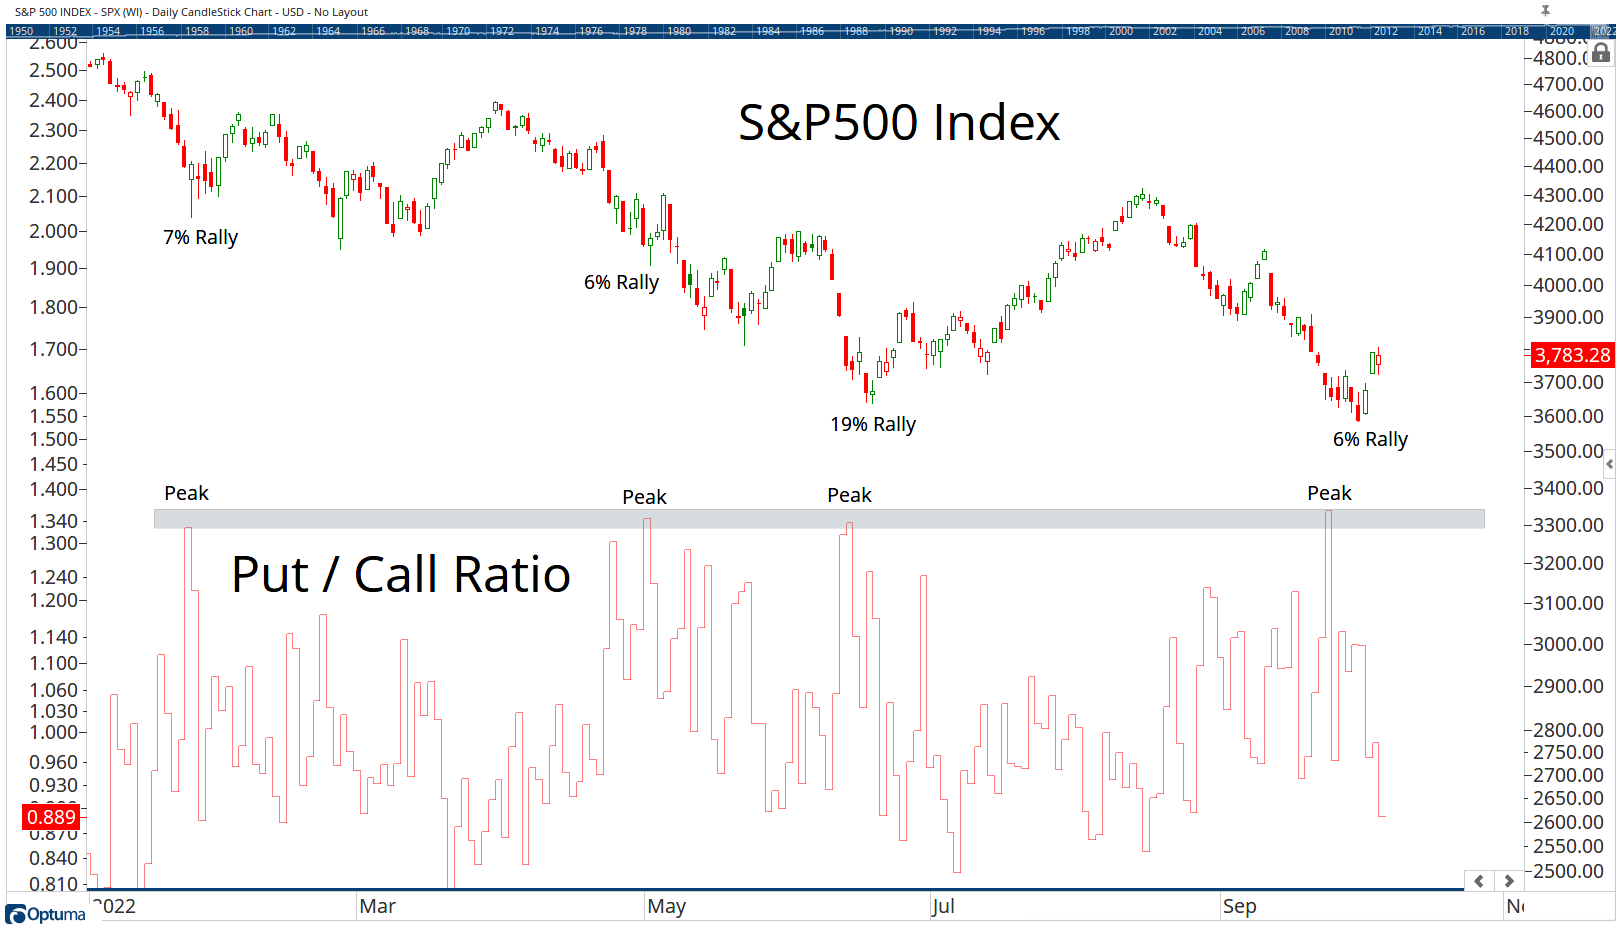
The Put / Call Ratio peaked out on the 23rd September and while this is only 1 of around 50 key data points to determine market direction, I find it quite interesting it peaked around the same level as previous short term market tops. ]
How can we interpret less bearishness? Is it bullish, or is it coiling up again for another spike?
The below chart might be a better visual.
The question everyone has, is something along the lines of could we get another sustained bear market rally like June or are we going to collapse? JUNE RALLY CALL HERE
I of course don’t have an answer to that, but I will be paying close attention to charts like the small caps.

If we look at a really good gauge of market risk sentiment, the Russell 2000 has held onto what I deem a big technical level.
The risk : reward favours longs, but as always, if price was to lose these important levels, I wouldn’t be hanging around.
I’d love the market to complete bottom here (I think we all prefer a rising market), but I just don’t see it in the charts or the data at the moment because everything’s in a down trend. That’s just how bear markets work.
I believe there is a possibility to take advantage of sustained rallies when they present themselves but I’m very mindful the market could absolutely tank at any moment. Aggressively long OR short is a recipe for stress.
What I will say is that this week I started presenting individual names / high conviction ideas for the 1st time in a few weeks (my work over the last few weeks has focused solely on the market major averages) but I’m very mindful that with a VIX in the 20s-30s…. as a minimum, you can expect wild intra day swings and stress.
Our Premium MIDWEEK HALF TIME ANALYSIS IS AVAILABLE HERE
Our Big Time Stamped Market Calls