


Daily Market News - 25th October 2022

The Bond Dead Bodies
The bond market.
It’s been front and centre this year with some notable 60/40 performance killers.
$AGG down a whopping 18% Year to date
$TLT down an eye watering 37% Year to date.
To state captain obvious, it’s been really tough for the bond market.
Last weeks letter covered the charts I’m focussed on within the currency markets, IF YOU MISSED IT, CATCH IT HERE.
This week, I want to take a closer look under the hood of the bond market and also touch on technology, to see if there’s any glimmer of light, and if there could be some kind of bullish catalyst for stocks on the horizon.
Before I get into the charts, let me lay out a few acknowledgments for those who like screaming at your device at the mere hint of the word “bullish”.
I understand inflation is through the roof
I understand the economic turmoil
I know there’s a war
I know there’s supply chain issues
I know economic models tell us it’s the 70s
I also know the market is forward looking, so with that out the way, lets start with an interesting divergence.
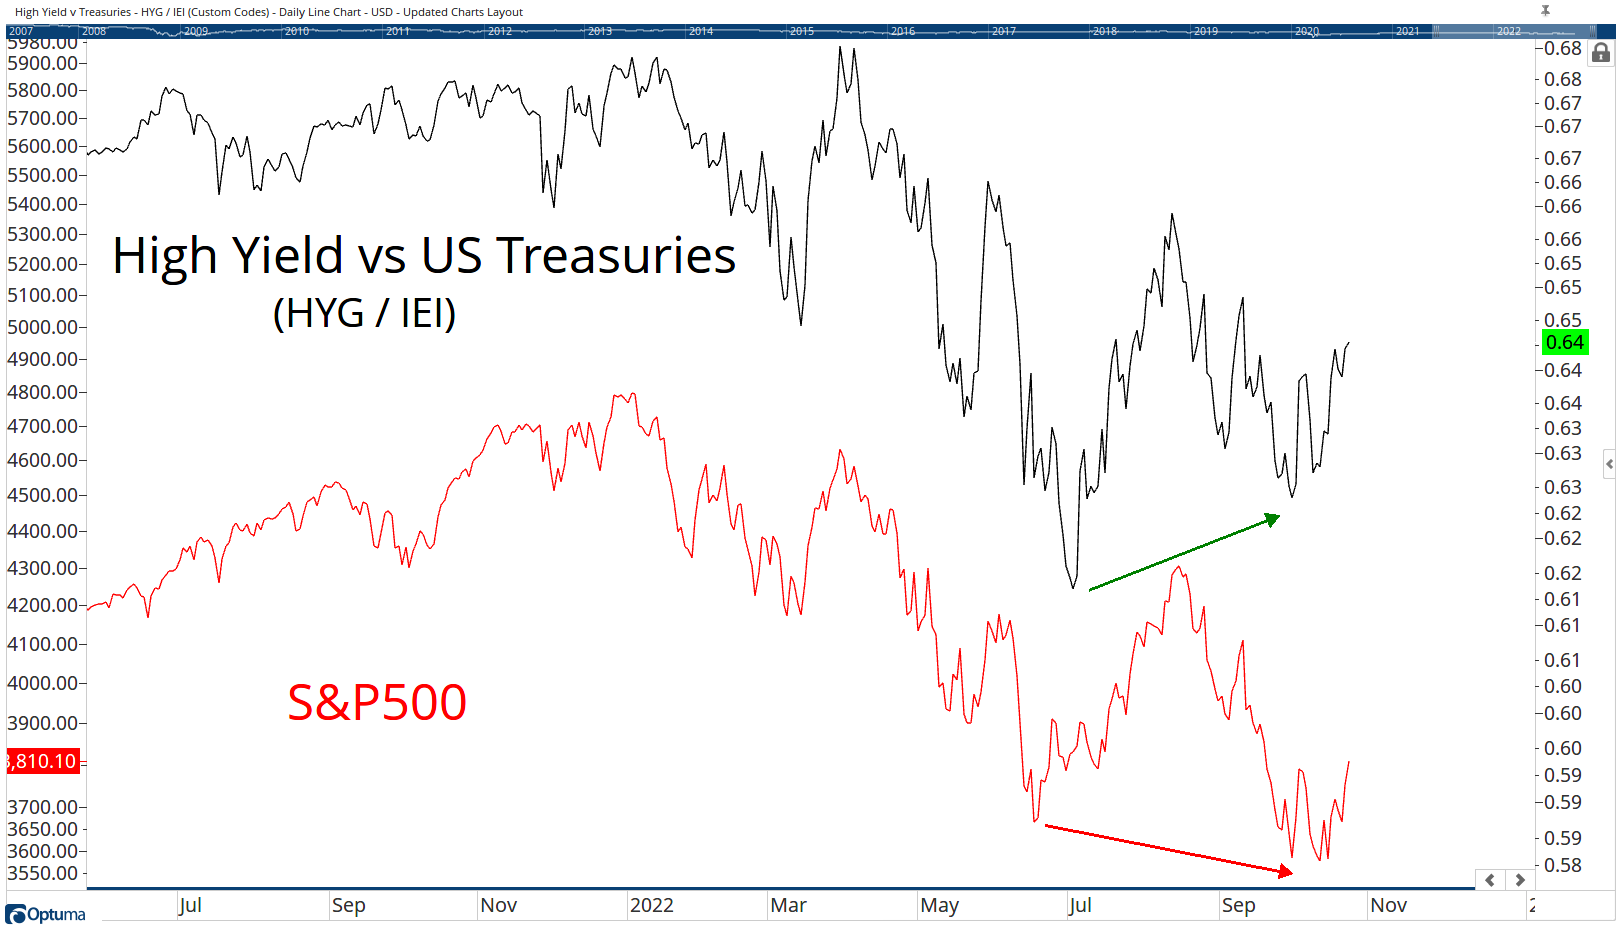
The textbooks tell us that where bonds go, stocks won’t be too far behind so having an awareness and paying attention to these divergences seems prudent.
In my opinion, for the market to have a prayer of a sustained rally into year end, it can’t do it without bonds.
Pension funds and the like are all handicapped by the performance in bonds. They simply cannot allocate to risk assets whilst the bond market is depressed.
Their risk models just won’t allow them to.

The $AGG chart is also showing small signs of divergence.
If you’ve followed my work over the years, you’ll already know I don’t like buying down trends, I’ve seldom been rewarded when bottom fishing, so I prefer to pay a higher price for the relative safety of knowing buyers are there, so waiting for a base to form (as per the chart) would be my preferred approach.
If the divergence starts to pay off, a move back above $96 would tell me we might be looking at a more “risk on” environment.
Lets now switch focus to tech.
With earnings season now in full swing, we all have our eyes on the mega caps.
How will the market react?
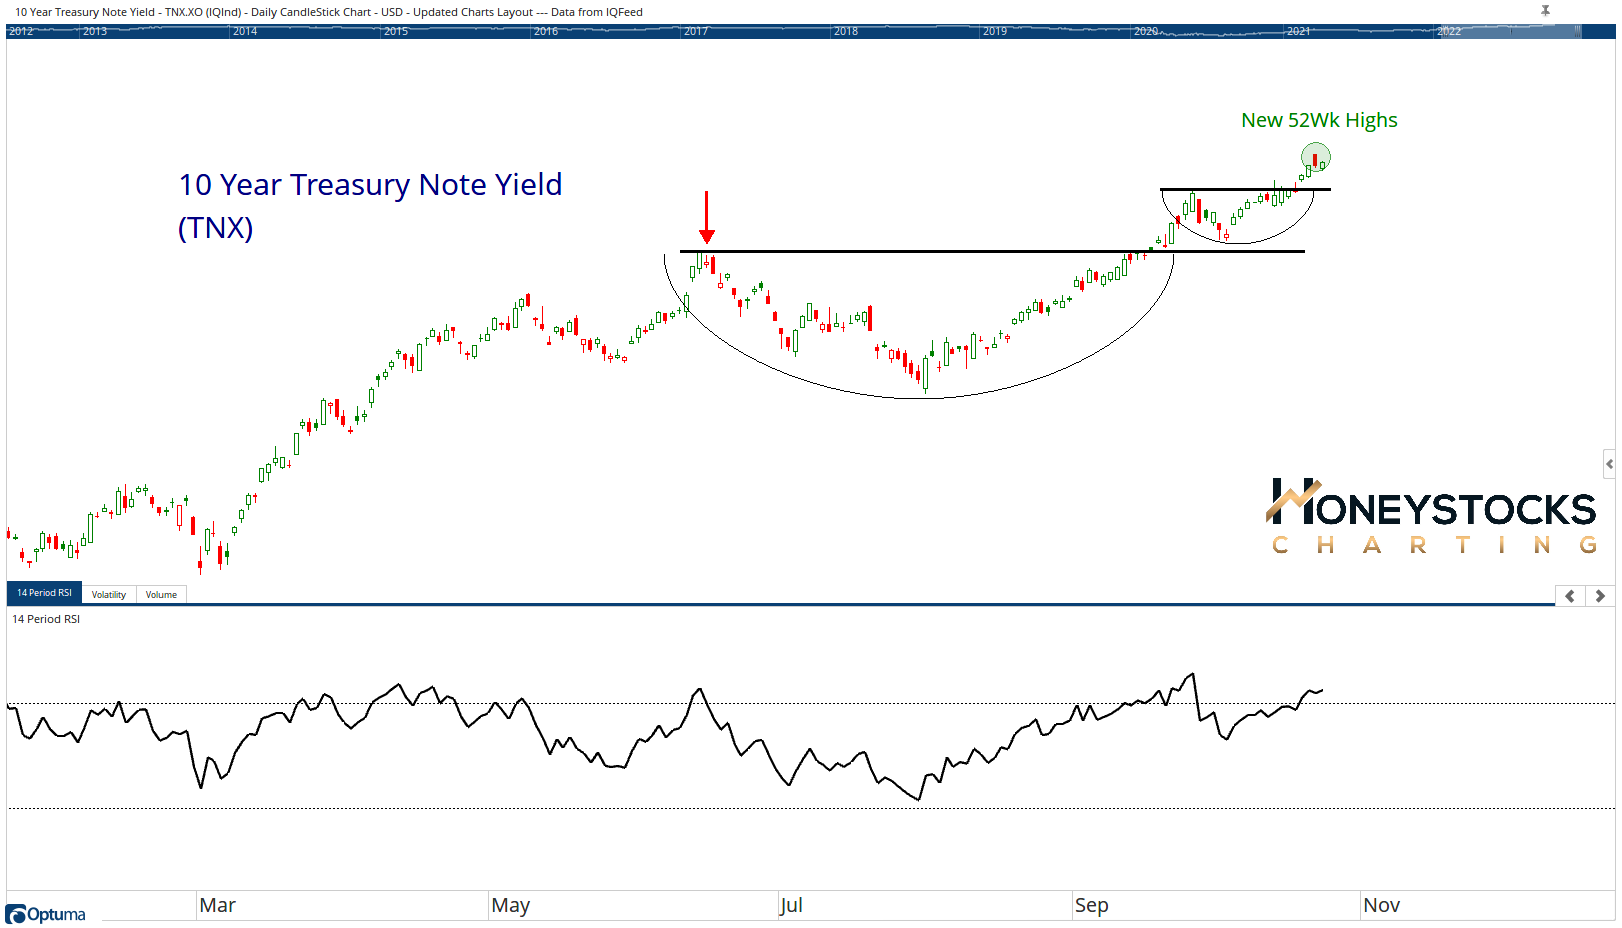
The 10yr note is making new 52wk highs which isn’t particularly bullish for “growthier” names, but if we take a look at something like XLK, the picture has another small glimmer of light.

What’s the old saying?
With failed moves come fast moves in the opposite direction.
We’re not going to know until the end of the week whether this chart has any merit. Big tech earnings will see to that.
But if you’re in the market doom and gloom camp, it’s perhaps not as cut and dried as you believe it is.
In Conclusion
It’s still a choppy market, that likely won’t change.
Our members have been receiving high quality long ideas for a few weeks now, they’ve been working well.
Over the next few weeks I’ll mostly be watching the bond and currencies markets.
What will you be watching?
Our Big Time Stamped Market Calls