


Daily Market News - 8th September 2022

In last weeks letter I said,
“Everyone’s super bearish, everyone’s now expecting a race to the June lows and probably capitulation after that, but what if we’re simply just putting in a higher low after recently reaching an overbought market condition”
Let’s all collectively hold our hands up and acknowledge it’s a stressful environment.
Up 1 minute, down the next, the VIX is spiking with large intra day swings, so unless you’re an accomplished day trader (which I am not) the juice probably isn’t worth the squeeze at the moment, especially if you’re not identifying the market turning points in real time.
I’m told I’ve been doing that well. (HERE and HERE).
That said, I like to look for risk : reward opportunities and easy to define risk charts so lets start with a chart I posted to Twitter yesterday.
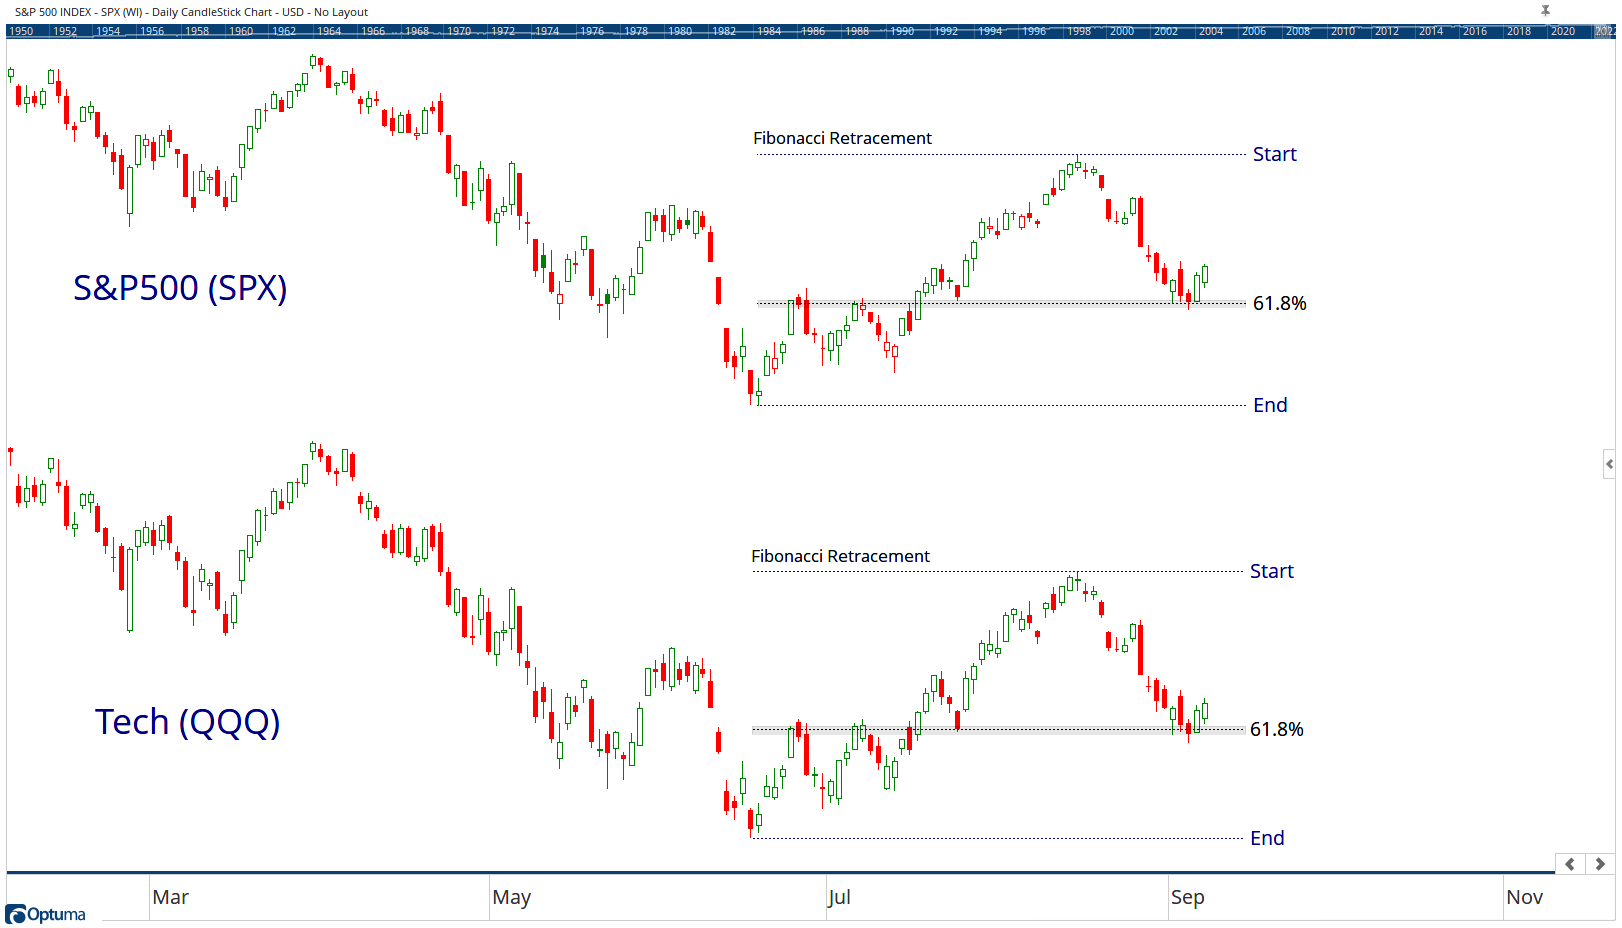
I like to pay attention to these levels in price for meaningful rallies. and that usually means using basic support / resistance levels.
If we’re going to get another bear market rally, this “might” be a place for it to happen.
However, (and this is a BIG however), a break below these levels and it’s probably a race to the June Lows.
With that in mind, lets take a looks at a few Tech charts I’m watching closely.

I 1st covered the NFLX chart 6 weeks ago on a break out from the base bottom.
It run straight into overhead supply at $250 but if you’re someone who likes basic chart patterns, it could be 1 to add to your watchlist.

I’ve been watching GOOG with a view to potentially buying in the $100-$102 area, the market probably has to come under a bit more pressure for it to get that low but again, I also think it’s worth adding to your watchlist.
So when I say buy low, sell high, these are the types of charts that make most sense to me. We might never get as low as $100, but if it does, I’ll be there waiting.

99.9% of you reading this just won’t know TMUS is a Fibonacci chart.
Taking the time to figure out what tools apply to each individual chart is why professional chartists exist.
I don’t know why it’s close to ATH’s, and frankly I don’t care so if you like stocks with relative strength, above $150 and it probably ticks a few more boxes.
To reiterate what I also said last week, “My best guess is we chop sideways”
There’s too much negative sentiment and too many negative news catalysts to get meaningfully long or short, or get too excited about anything but there are opportunities if you’re prepared to dig a little deeper beyond the headlines.
I also laid out a bunch of charts at the weekend.
Our Big Time Stamped Market Calls